Solar
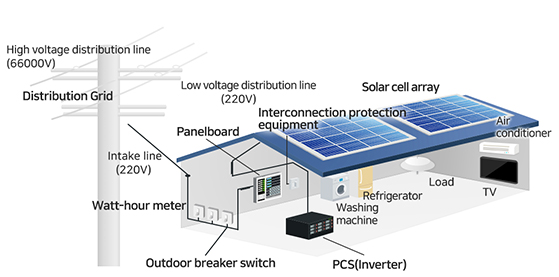
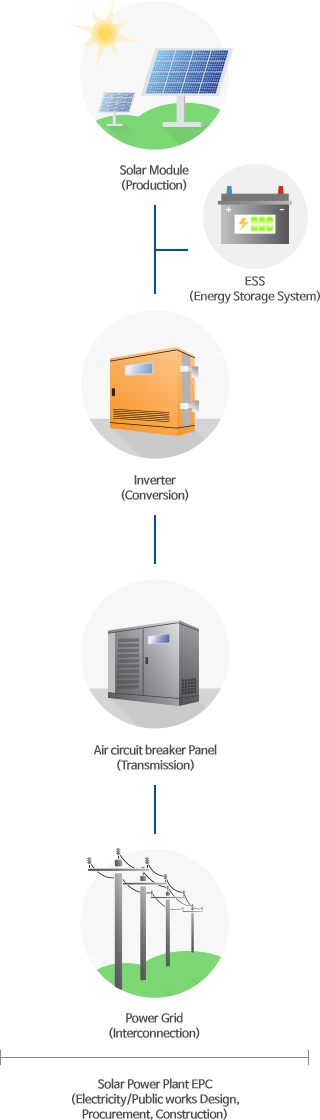
Solar power generation is an electrical power generation technology that takes the solar energy of the sun and converts it into electricity using photovoltaic cells that generate electrical power through a photoelectric effect that occurs when sunlight is received.
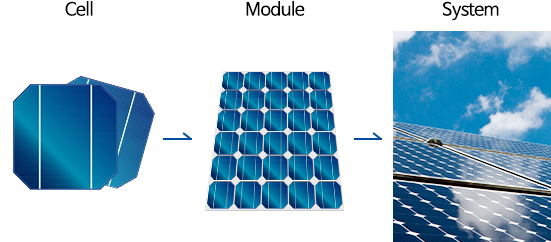
- Module
-
- Equipment that converts sunlight into electricity
- Product lifespan and guaranteed performance : 25 years
- Over 10 years 90%
- Over 25 years 80%
- Inverter
-
- Converts direct current (DC) into alternating current (AC)
- Electricity generated by solar modules sold to KEPCO
- Device that converts the current into a form usable by a household
- Converts direct current (DC) into alternating current (AC)
- Structure
-
- Structure that can maintain the optimal state for the modules to receive solar energy.
- Fixed, variable, tracking
- Structure that can maintain the optimal state for the modules to receive solar energy.
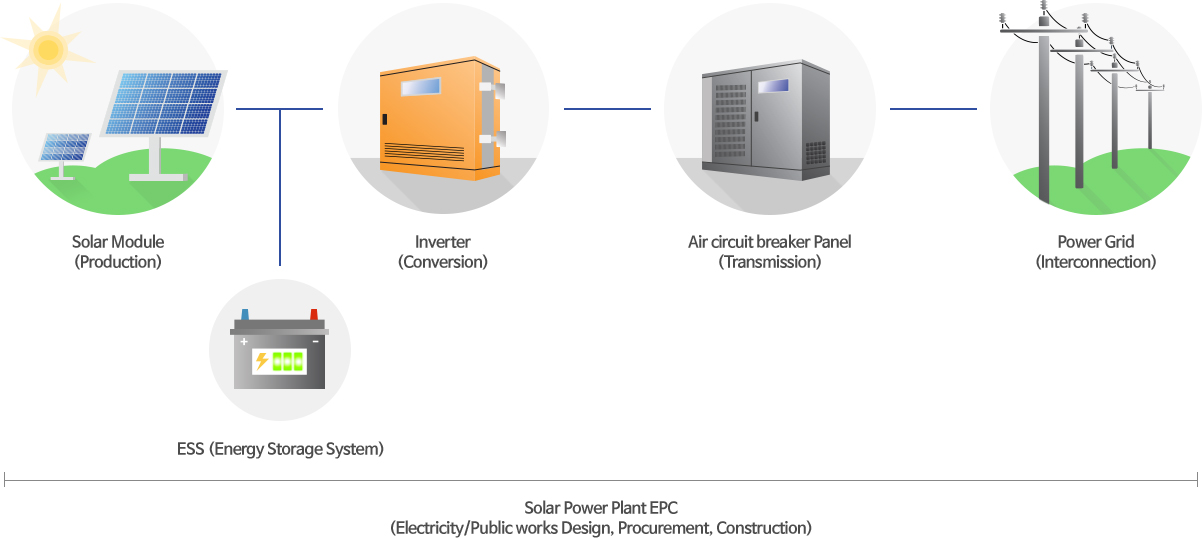
With top quality materials from our strategic partnerships with world-class domestic and international manufacturers, in addition to our outstanding distribution know-how, we can ensure the construction of power stations of the highest quality.
The business of solar power generation is one that generates profits by selling the power generated by a business’ power stations to KEPCO and other power companies.
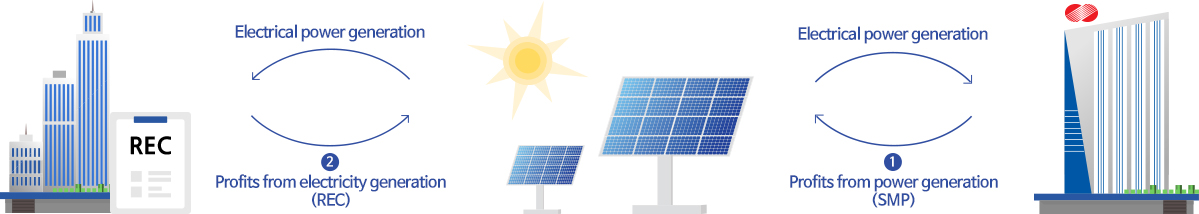

- SMP(System Marginal Price) : Price at which generated electricity is sold to KEPCO (KRW/KWh)
- REC(Renewable Energy Certificate) : A certificate that sets forth the price at which electricity that is generated/supplied through new renewable energy is sold to mandatory supplier power companies.


RPS(Renewable Portfolio Standard, 'Mandatory Supply Policy‘) is a system that supports the expansion of the new renewable energy sector by making it mandatory for power suppliers over a certain size to supply a certain percentage of their total supplied power through new renewable energy sources.
Renewable Portfolio Standard (RPS)
Mandatory supplier: Businesses that possess power generation facilities of 500,000 kW or more (excluding new renewable energy facilities); 18 electric power companies fall under this classification.
(6 electric power subsidiaries, 10 private electric power companies, and 2 public utilities)
- Annual supply obligation
- Annual supply obligation = total amount generated (excluding amount generated by new renewable energy sources) X obligation ratio (%)
| Year | 2012 | 2013 | 2014 | 2015 | 2016 | 2017 | 2018 | 2019 | 2020 | 2021 | 2022 |
|---|---|---|---|---|---|---|---|---|---|---|---|
| Obligation ratio (%) | 2.0 | 2.5 | 3.0 | 3.0 | 3.5 | 4.0 | 5.0 | 6.0 | 7.0 | 8.0 | 9.0 |
| Year | Obligation ratio (%) |
|---|---|
| 2012 | 2.0 |
| 2013 | 2.5 |
| 2014 | 3.0 |
| 2015 | 3.0 |
| 2016 | 3.5 |
| 2017 | 4.0 |
| 2018 | 5.0 |
| 2019 | 6.0 |
| 2020 | 7.0 |
| 2021 | 8.0 |
| 2022 | 9.0 |
- Moon Jae-in administration’s new renewable energy 3020
With top quality materials from our strategic partnerships with world-class domestic and international manufacturers, in addition to our outstanding distribution know-how, we can ensure the construction of power stations of the highest quality.
- Price trends for strategic sales
-
- REC prices for both the contract market and the commodities market have maintained an upward trend since April 2015.
- SMP is a price set by KEPCO through daily analyses of the electrical power supply and demand.
- REC prices for both the contract market and the commodities market have maintained an upward trend since April 2015.
REC(SMP) Avr.

REC(SMP) average per month(2016year~2018year)
| year | 1 | 2 | 3 | 4 | 5 | 6 | Average |
| 7 | 8 | 9 | 10 | 11 | 12 | ||
| 2016 | 112.970 | 166.810 | 100.897 | 106.436 | 123.049 | 119.558 | 136.431 |
| 130.774 | 140.515 | 150.733 | 169.757 | 147.833 | 167.834 | ||
| 2017 | 151.515 | 141.249 | 121.747 | 124.500 | 130.970 | 128.057 | 127.593 |
| 126.646 | 127.132 | 127.327 | 127.591 | 120.781 | 103.598 | ||
| 2018 | 110.119 | 110.560 | 101.068 | 108.463 | 109.849 | 107.324 | 107.420 |
| 104.557 |
| year | 1 | 2 | 3 | 4 | Average |
| 5 | 6 | 7 | 8 | ||
| 9 | 10 | 11 | 12 | ||
| 2016 | 112.970 | 166.810 | 100.897 | 106.436 | 136.431 |
| 123.049 | 119.558 | 130.774 | 140.515 | ||
| 150.733 | 169.757 | 147.833 | 167.834 | ||
| 2017 | 151.515 | 141.249 | 121.747 | 124.500 | 127.593 |
| 130.970 | 128.057 | 126.646 | 127.132 | ||
| 127.327 | 127.591 | 120.781 | 103.598 | ||
| 2018 | 110.119 | 110.560 | 101.068 | 108.463 | 107.420 |
| 109.849 | 107.324 | 104.557 | |||
SMP Avr.
SMP average per month(2016year~2018year)
| year | 1 | 2 | 3 | 4 | 5 | 6 | Average |
| 7 | 8 | 9 | 10 | 11 | 12 | ||
| 2016 | 103.598 | 120.781 | 127.591 | 127.327 | 127.132 | 126.646 | 127.593 |
| 128.057 | 130.970 | 124.500 | 121.747 | 141.249 | 151.515 | ||
| 2017 | 167.834 | 147.833 | 169.757 | 150.733 | 140.515 | 130.774 | 136.431 |
| 119.558 | 123.049 | 106.436 | 100.897 | 166.810 | 112.970 | ||
| 2018 | 104.557 | 107.324 | 109.849 | 108.463 | 101.068 | 110.560 | 107.420 |
| 110.119 |
| year | 1 | 2 | 3 | 4 | Average |
| 5 | 6 | 7 | 8 | ||
| 9 | 10 | 11 | 12 | ||
| 2016 | 103.598 | 120.781 | 127.591 | 127.327 | 127.593 |
| 127.132 | 126.646 | 128.057 | 130.970 | ||
| 124.500 | 121.747 | 141.249 | 151.515 | ||
| 2017 | 167.834 | 147.833 | 169.757 | 150.733 | 136.431 |
| 140.515 | 130.774 | 119.558 | 123.049 | ||
| 106.436 | 100.897 | 166.810 | 112.970 | ||
| 2018 | 104.557 | 107.324 | 109.849 | 108.463 | 107.420 |
| 101.068 | 110.560 | 110.119 | |||
- Renewable energy related links
-
With top quality materials from our strategic partnerships with world-class domestic and international manufacturers, in addition to our outstanding distribution know-how, we can ensure the construction of power stations of the highest quality.
- Price trends for strategic sales
-
- REC prices for both the contract market and the commodities market have maintained an upward trend since April 2015.
- SMP is a price set by KEPCO through daily analyses of the electrical power supply and demand.
- REC prices for both the contract market and the commodities market have maintained an upward trend since April 2015.
- SMP
- REC 계약시장
- REC 현물시장